This is a data analytics of a Twitter account with datasets in Excel files that were merged, unionized and visualized using Tableau Dashboard
Background:
Throughout the summer of 2022, some individuals, who are currently my teammates and I, were planning on a fan project in multiple cities to support a Korean pop group named (G)I-DLE for their first USA tour. We faced serious challenges because we did not know whom to contact for fundraising and spreading the word about the event. We tried to reach out to well-known people in the fandom. That solved part of the issues, but it created some confusion due to miscommunication.
On the date of the concerts, we explained the event to each person in the line and provided instructions on what to do. Despite our effort, there were not many people that participated in it. Even though the artists acknowledged our event, it did not show the unity of the fandom. Thus, to establish a dedicated source for USA fandom about projects, we created the account.
There are many existing accounts for updates on news and social media posts for the group’s members but not a lot of reliable translations. Therefore, we only post translations on our account. This report will give us with better information to appeal to more followers without posting constantly.
Key insights:
- Distinctive content in tweets help us stand out for a great start.
- Regardless of the degree of activity, the context of tweets is a crucial element to attract attention.
- Uploading translations of older material during periods of low activity may potentially increase engagement.
Discussion:
1. Dataset Description:
The first dataset of each month has 22 columns: Tweet id, Tweet permalink, Tweet text, time, impressions, engagements, engagement rate, retweets, replies, likes, user profile clicks, URL clicks, hashtag clicks, detail expands, permalink clicks, app opens, app installs, follows, email tweet, dial phone, media views, media engagements. The second dataset has 19 columns which are mentioned above except Tweet id, Tweet permalink, and Tweet text, also the time column is replaced with a date in the second data set.
First, some variables are eliminated due to their relevance and inaccuracy. The first dataset is used to visualize time series data by hours and weekdays in detail. The second dataset is used to summarize the data over months. Each dataset is a union of five sub-datasets.
2. Analytics:
In 5 months, we posted 1023 tweets and gained 14,796 impressions, 1,048 engagements, and 262.1 media engagements on average. September has the highest number of tweets posted at 293, and still October has the highest average impression, engagement, and media engagement.
• August:
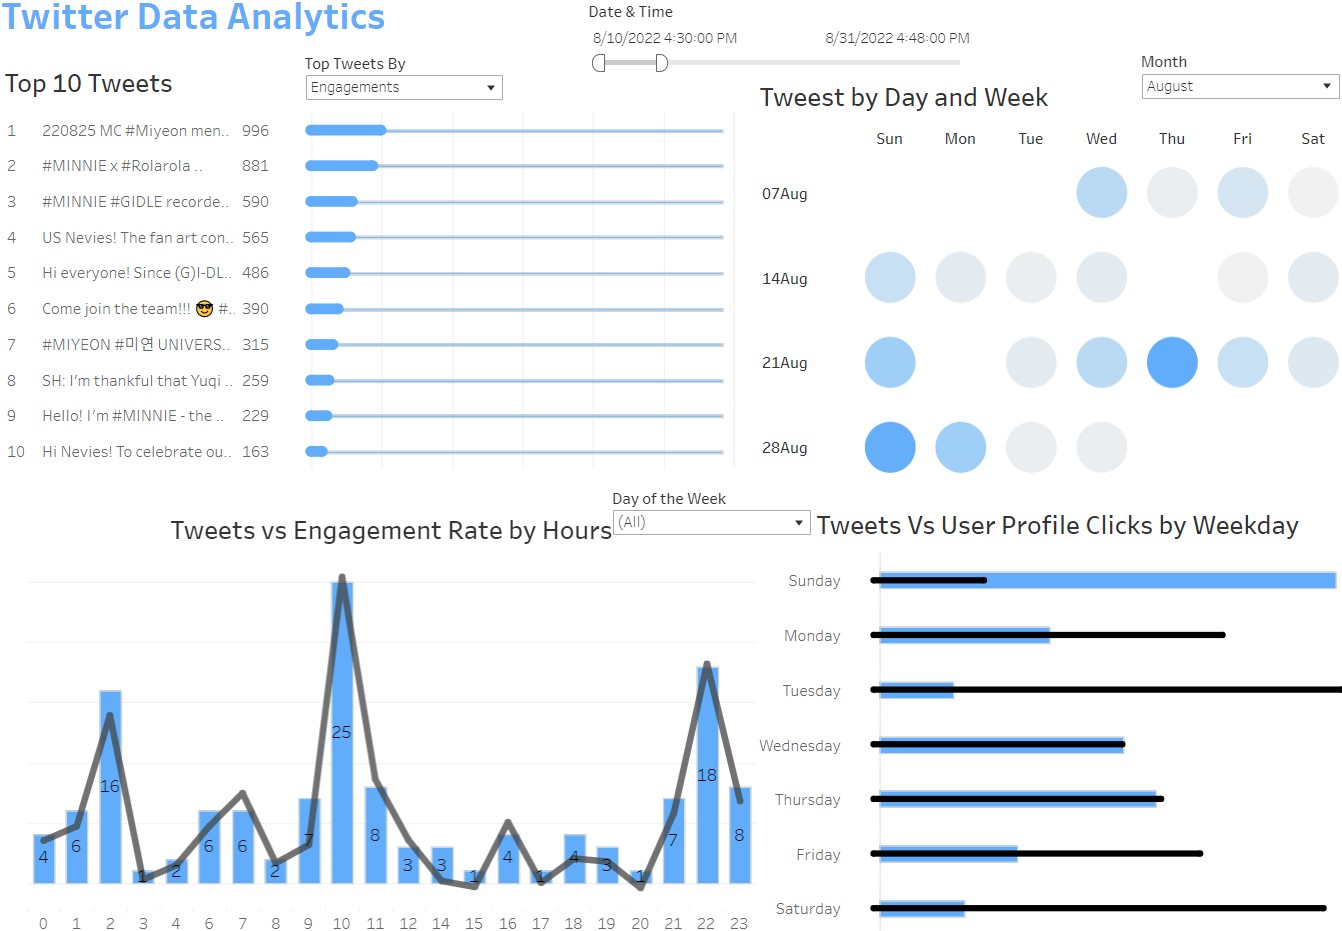
In August, we posted mostly on Sundays followed by Thursdays and Wednesdays. However, these did not gain as many user profiles click compared to other days such as Tuesdays and Saturdays.
The engagement rate is increasing and decreasing consistently with the number of tweets posted, except at certain hours when the tweet numbers are similar, but the engagement rate is not. For example, at 6 o’clock and 7 o’clock, the number of tweets posted is the same, but the engagement rate is higher at 7 o’clock, similarly, at 16 o’clock the engagement rate is double that at 18 o’clock.
The tweet with the most engagements was on August 25. It is a translation of a segment of the weekly music show where a member is a MC that has rarely been translated by anyone. The second one is a new video of a brand endorsement we were the first to find out about and posted it. The third one is an announcement of a Thai member doing a song cover in Chinese, which piqued the interest of many people.
• September:
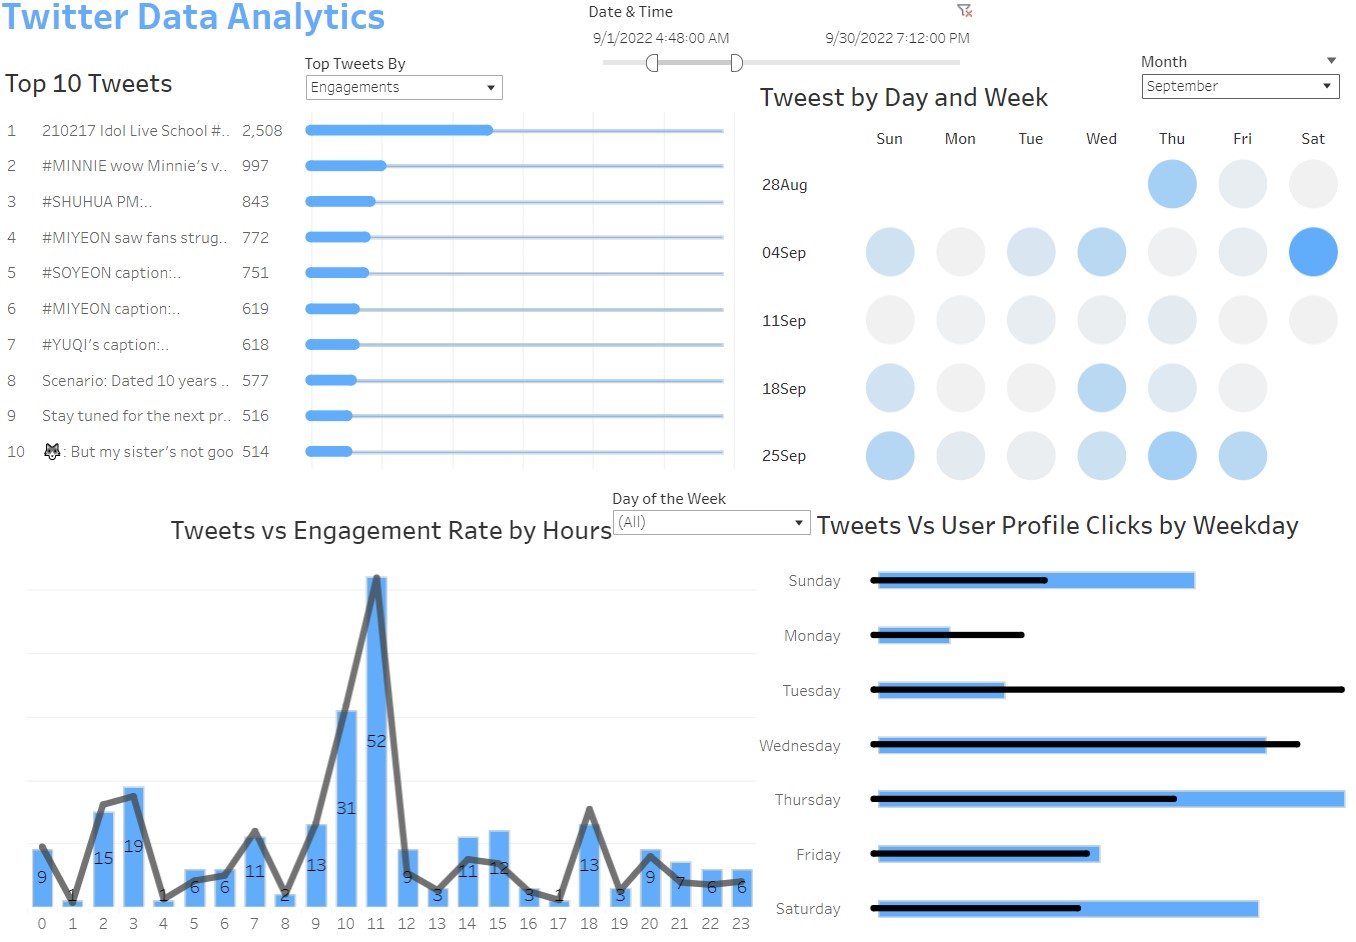
In September, we posted every day with the most on Thursdays, Saturdays, and Sundays. While tweets on Saturdays and Tuesdays in August attracted more users, in September only tweets on Tuesdays maintained the attraction with the small number of tweets posted.
Moreover, the engagement rate is also much more correlated with the tweet numbers in September.
We had 1 tweet that had significant high engagements because it is a short translation of a show between an ex-member with a current member. The rest of the tweets in the top 10 has a lot more engagements with the lowest one as 514. Meanwhile, the 10th tweet in August is 163. We got consistency in engagements from posting content that was challenging and taking longer to get for fans living outside of South Korea.
• October:
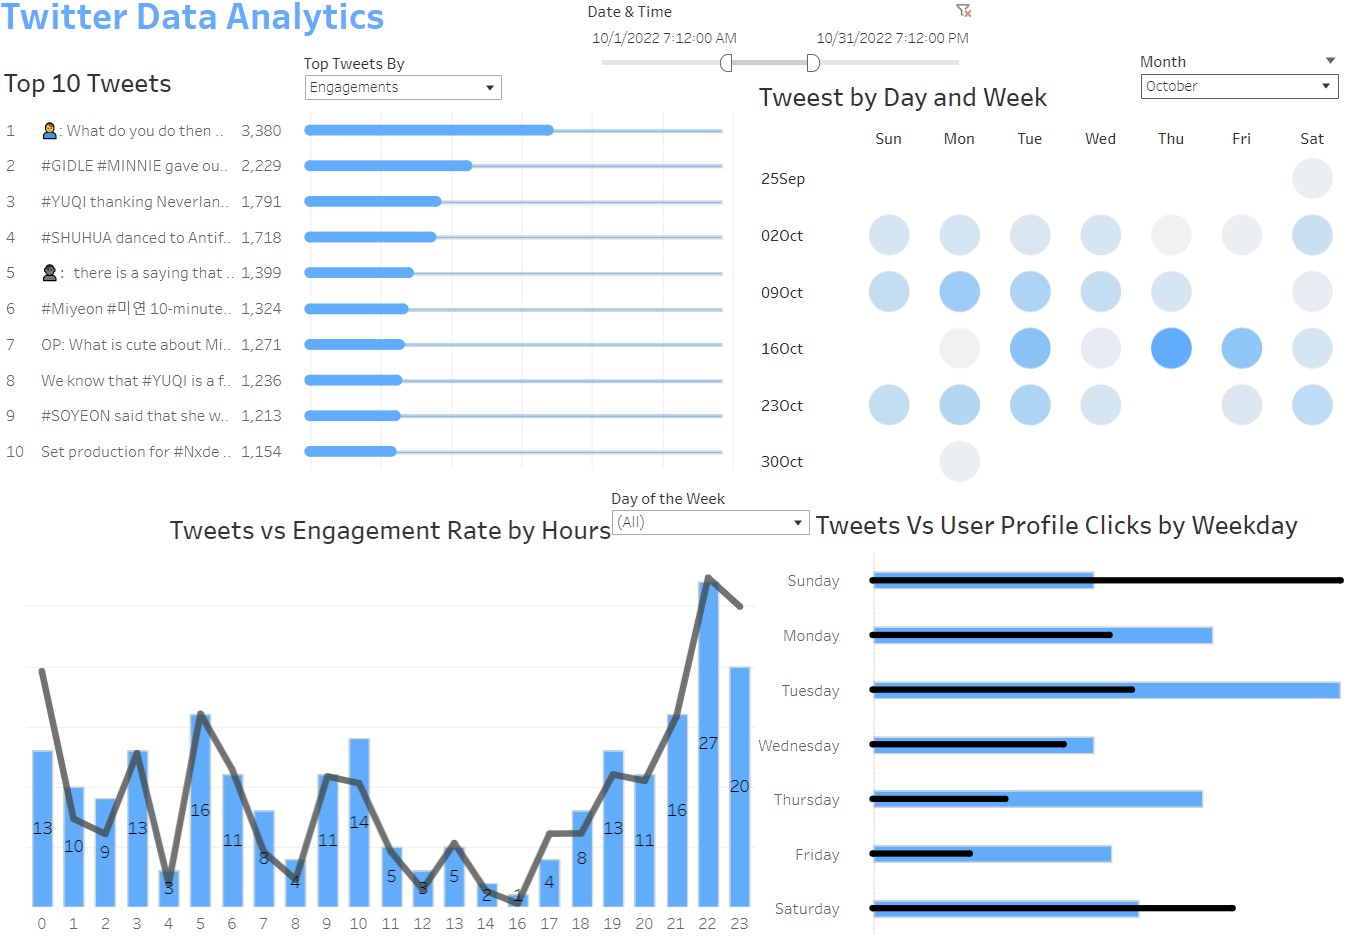
In October, there are more days where we did not post versus in September. Nonetheless, the overall number of tweets posted per day is relatively similar except Tuesdays. In contrast with September where tweets on Tuesdays got the most user profile clicks, in October, tweets on Sundays got the most user profile clicks.
The correlation between engagement rate and the number of tweets posted is still high with some outliners. At 0 o’clock with 13 tweets posted, the engagement rate is significantly higher than at 3 o’clock and 19 o’clock, and at 10 o’clock, even though we posted 14 tweets, the engagement rate goes down instead of going up.
The engagements of the top 10 tweets are incredibly high in October. We can see that they are all higher than 1000 while in September. Only the top 1 tweet has more than 1000; there was no tweet that had more than 1,000 in August. The reason for this unusual behavior is the group’s announcement to release a new album on Oct 17th. As a result, the fans were way more active on social media.
The tweet that got more than 3,000 engagements is about a member, who is the leader and in charge of producing songs, writing lyrics, and giving critical ideas and opinions. She was explaining other members’ roles in the group and hers was taking copyrights. The 2nd and 3rd tweets are a member giving out lipsticks to fans and another member saying how thankful they are. The 4th tweet which also has around 1,700 engagements is about the youngest member trying a difficult dance move from another group that is considered as their viral.
Conclusion:
Since we first created the account and started being active on August 11, 2022. On average, we gained 200 new followers each month. We currently have 996 followers on January 31, 2023. Although we are lacking geographic segmentation of our followers to determine whether we will be able to achieve our main goal for in-person events in the USA. I believe we have been moving in the right direction to build our online presence. Through this report, we can identify the topics we should post to increase engagement depending on the occasion instead of posting everything.
During months that have low activity from the group, we can post a translation of something that has never been translated before, on the other hand, during high-activity months, when there are a lot of active translators, we should only post when members are praising the group unique characteristics, heartful interactions with fans, mention of other popular groups and more. Based on the data from August to October, the optimal days to post would be during the beginning of a week or on weekends.
Unlike the steady engagement rate regardless of the posting hours in October, the graphs in August and September indicate that it would be ideal to post between 10 to 12 o’clock and 20 to 23 o’clock. Despite that, the most crucial factor to gain user attention is still the context of the tweets. Furthermore, we can host online or offline events limited to USA fans to estimate the number of USA-based followers we have.