This is an analyzation of Parking Citation data, Income data and Tract data in San Francisco to identify possible racial and/or economic disparities. Project Code (Python)
Background:
Every year, the business of parking citations in major metropolitan cities across America grosses hundreds of millions of dollars in revenue. The City of San Francisco, California earns the second highest spot in revenue per capita approximated at $98.80 in 2017. Chicago was ranked 4th in revenue, however, the city received some criticism after leasing its parking meter business to private enterprises in 2008. On which, several research papers point to a stark disparity of citation frequency across neighborhoods of differing minority and income demographic. With this in mind, it begs the question on whether citation practices remain ethical in San Francisco. We look into a 2018 public dataset on citations drawn to investigate any signs of high citation frequency and revenue within Minority and Low-income blocks, also known as ‘Tracts’.
Key insights:
- The analysis examines citation frequency and revenue disparities in different neighborhoods of San Francisco City based on minority and income demographics.
- The dataset includes 10 variables and over 1 million rows of data.
- Primary response variables measured were revenue per capita, citation counts, and average fine amount.
- No clear evidence of disparities between upper and lower-income classes in citation behavior was found.
- However, the lower class pays more in fines for certain violations, suggesting potential disparities in citation practices.
- The analysis reveals possible discrepancies in citation behavior, particularly with average fine amounts.
- Further research is needed to investigate other potential confounding variables.
Introduction/Datasets Description::
The analysis focuses on investigating the frequency of parking citations in San Francisco and its potential correlation with the demographics of the neighborhoods where the citations are issued. The San Francisco Citations dataset, containing over 1 million rows of citation data, was used to determine the violation description, vehicle plate state, fine amount, and geographical coordinates of each citation. The citations were then matched with their respective neighborhoods using the Tract Coordinates dataset, and the Tract Demographics dataset was used to gain insights into the population demographic of each neighborhood.
The analysis involved merging the three datasets, resulting in a table with 959,056 citations and 11 variable columns. The variables were grouped and analyzed by Tract Code, Income Level Class, and Violation Type to determine any significant relationships and trends. The approach involved looking at the general distribution of each variable, establishing response variables that measure citation behavior, and conducting preliminary analyses between variable pairings to determine citation behavior. Relevant associations were further analyzed within each income class and between the four income classes to investigate citation behavior across particular violation types.
Results of Tract Grouped Dataset:
The dataset was processed by grouping all columns by tract code and averaging them. An additional count column was generated by aggregating the number of citations for each tract code, and this allowed for the calculation of revenue per capita by dividing the average fine amount by the average population. The average revenue per capita for San Francisco City was $120.80.
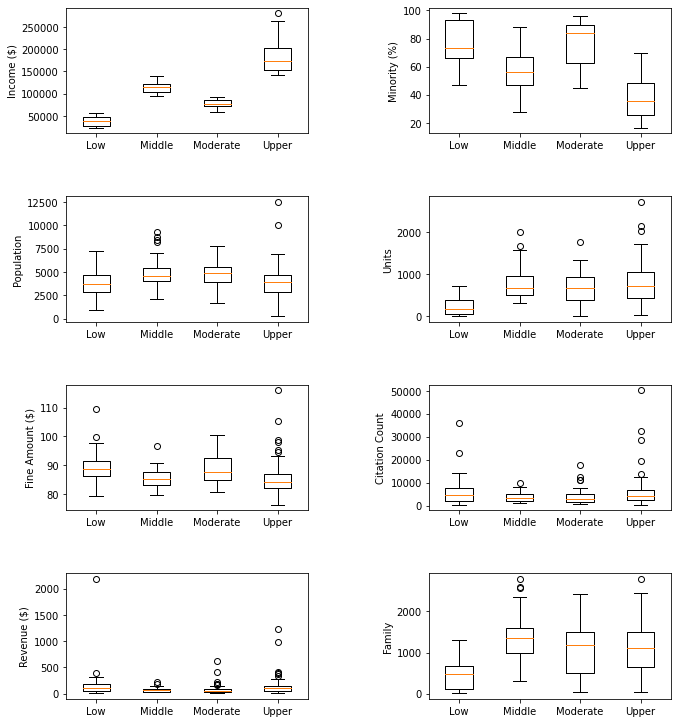
Figure 1 shows the distribution of variables, segmented by class, and it demonstrates how the upper income class has the highest median income but the lowest percentage of minority population in its tracts, with a wider range of owner and family units occupied. Surprisingly, despite having a higher median income, the median citation counts, and average revenue/fine amount fall in line or even slightly below other classes.
 |
|---|
| Fig 1: Boxplots of Tract Averages by Income Level |
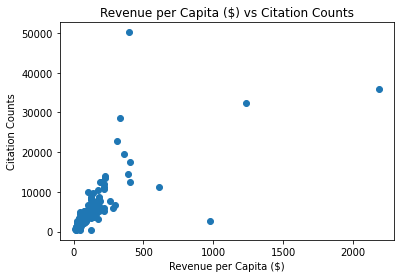
Figure 2 confirms a positive relationship between citation frequency and generated revenue, while Figure 3 shows that the average fine amount increases at a steeper rate than revenue.
 |
|---|
| Fig 2: Relationship of Citation Counts and Revenue |
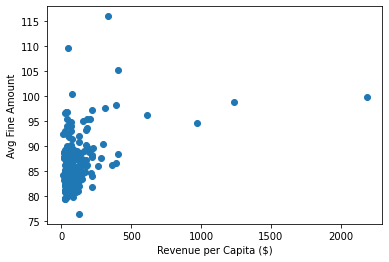 |
|---|
| Fig 3: Revenue per Capita ($) vs Avg Fine Amount |
Since the preliminary findings do not point to any evident disparities between the upper- and lower-class tracts, we further investigated the same interactions we have touched on, specifically between the income classes.
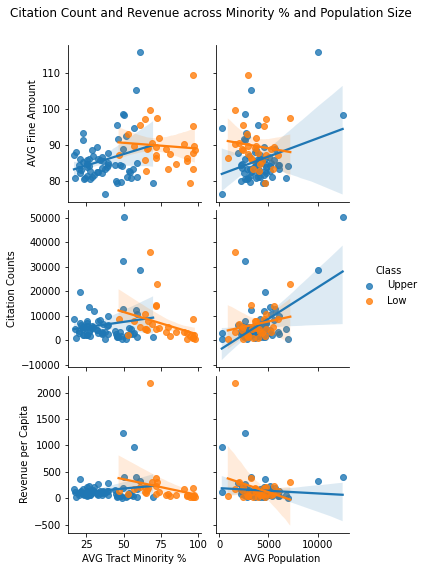
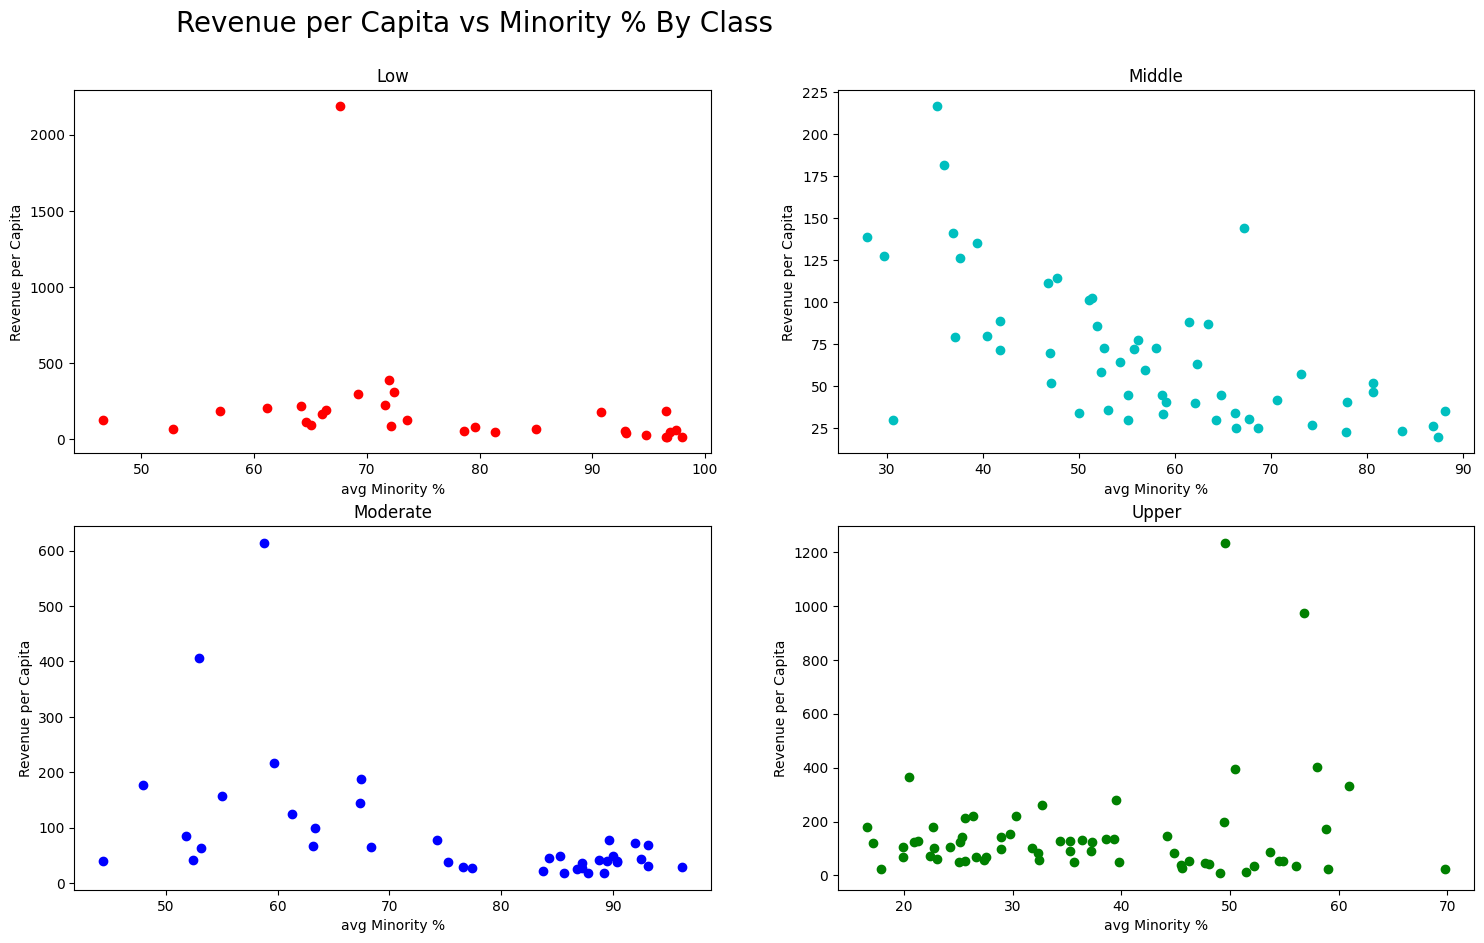
In figure 4 it appears that the upper class has an increase in citation frequency and revenue as minority population increases, and there is a reversal of associations between the upper and lower classes for average fine amount and population size, which suggests a potential difference in citation value between the two classes. However, there are a few high outlying values which largely determine the slopes of the lines, which would need further testing to determine if they are outliers or high leverage data points and if they are influential.
 |
|---|
| Fig 4: Citation Count and Revenue Across Minority % and Population Size |
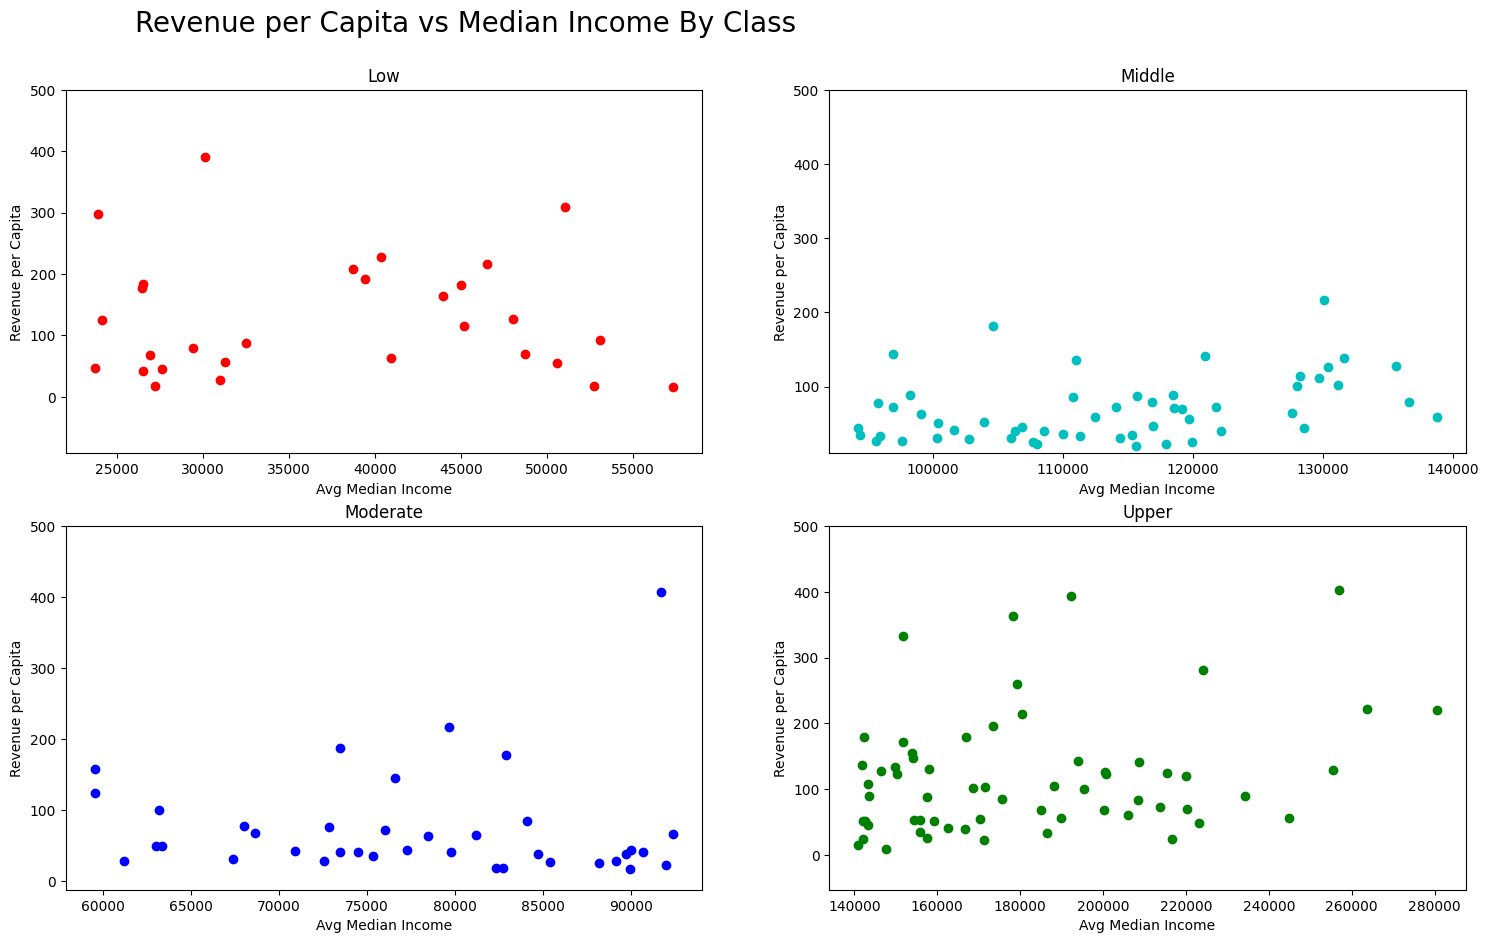
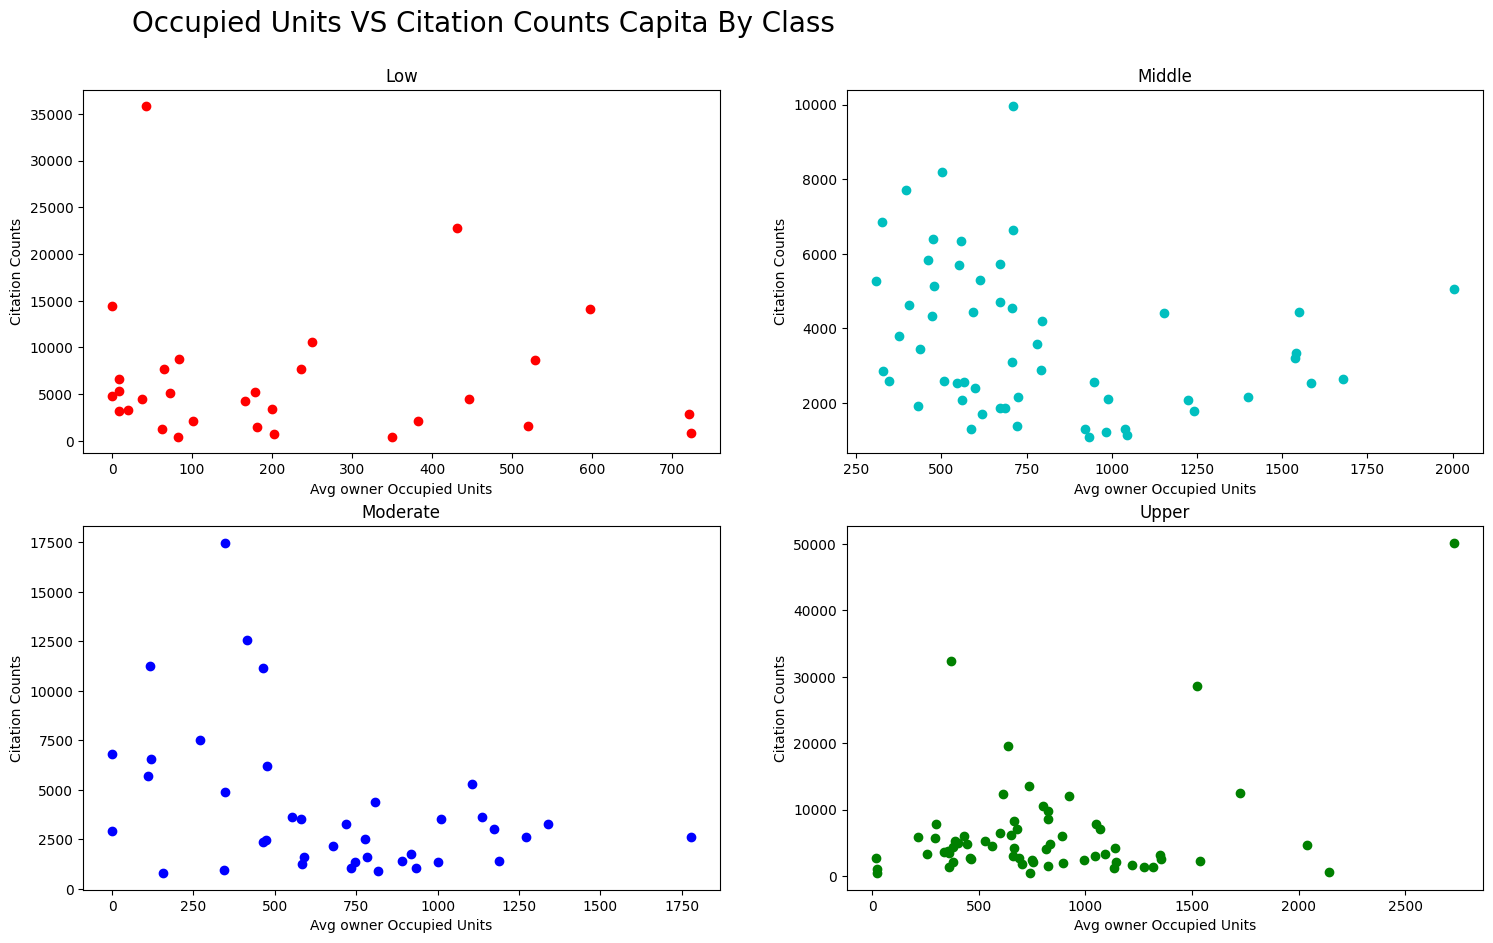
To examine the associations between variables within each class, we plotted the data accordingly. Figure 5 shows a lack of association within the Moderate, Middle, and Lower classes, but a slight upward trend in revenue for the Upper class as income increases. Figure 6 shows a lack of association within both classes for the relationship between income and citation counts, but a positive correlation for the Middle class, raising suspicions of disproportionate citations in these tracts. Figure 7 confirms our suspicions of disparity, with a negative relationship between counts and owner-occupied units in the Middle class, implying that middle class neighborhoods with less home density and higher average income are targeted with citations more.
 |
|---|
| Fig 5: Revenue per Capita vs Median Income By Class |
 |
|---|
| Fig 6: Average Median Income vs Citation Counts by Class |
 |
|---|
| Fig 7: Owner Occupied Units vs Counts by Class |
Results of Income Class Grouped Dataset::
From Figure 8, we can see the significant difference in average revenue between lower class and others. It doubled the value of average revenue for each middle and moderate class, and around $50 higher than the upper class. Though the average fine amount is similar for all classes, it is still slightly higher in the lower class.
 |
|---|
| Fig 8: Avg Fine Amount and Avg Revenue per class |
Moreover, Figure 9 shows how despite having the least average population size, the lower class leads in average citation counts. The upper class appears to be the only class with the most consistent and logical citation behavior through the lens of these variables, hinting that citation disparity might exist in San Francisco.
 |
|---|
| Fig 9: Avg Population and Avg Citation Counts per class |
Results From Violation Type Grouped Dataset:
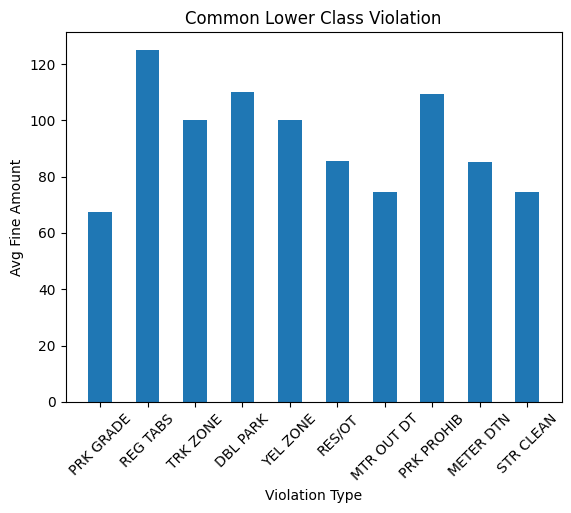
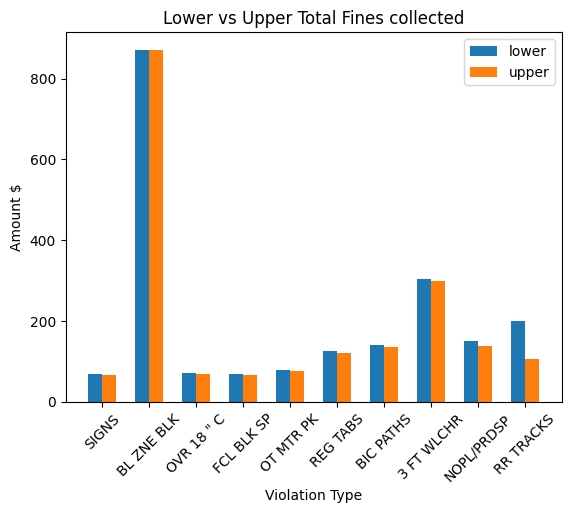
Figures 4, 8, and 9 support our suspicion of disparity against lower-income neighborhoods regarding average fine amounts, but not in the relationships shown in the scatterplots. To investigate further, we grouped the dataset by Violation Type/Description and computed the average fine amount for each. Figure 12 shows that the lower class is occasionally cited with a higher fine amount for certain violations than the upper class, with differences averaging up to $3.72 more. This suggests that add-on fees for late penalties, etc., may be the cause of the differences in fine amounts.
 |
|---|
| Fig 10: Common Lower Class Violation Types |
 |
|---|
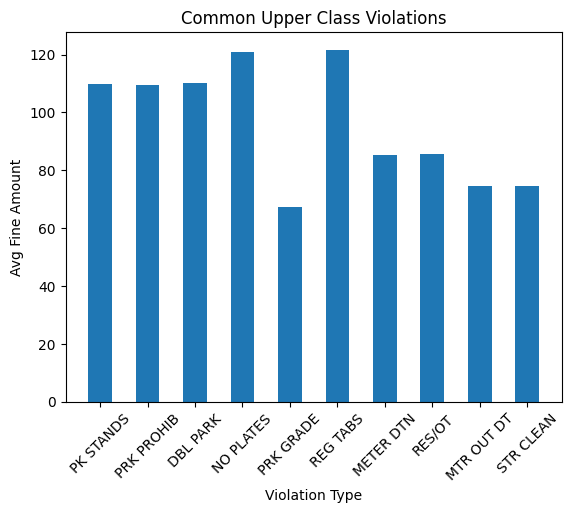
| Fig 11: Common Upper Class Violation Types |
 |
|---|
| Fig 12: Violation Type by Fine Collected for Lower and Upper Class |
Conslusion:
Initial analysis of the merged citation dataset showed hints of disparity across income classes. While there were no significant associations seen between overall citation behavior and income class, a trend emerged where lower-income areas received higher average fine amounts. Further investigation with scatter plots segregated by income class discovered possible increased ticketing frequency in certain middle-class tracts. The lower income class outperformed the upper class in citation frequency by 32%. It was discovered that different income classes are possibly being cited different amounts for the same violations, or more likely, due to add-on late fees. The lower class paid more than the upper class for 46.3% of violation types, while the upper class paid more than the lower class for only 18.3% of types. Regardless, without concrete testing, sampling, and research into other confounding variables influencing citation behavior, we cannot confirm the presence of citation disparity against low-income, minority-based communities solely on this analysis.
Future Analysis:
We considered using geographical heat maps but due to time constraints, we opted for a more explanatory analysis. Future analyses could account for additional demographic variables such as age, registered businesses, and parking infrastructures. Missing tract data could also be supplemented with demographic details from a single source. More analyses, including time-series and prediction models, could be done. Additionally, researching parking meter business practices and regulations would provide more context for data cleaning and speculation on discrepancies.
References:
- Chicago's Parking Meter Deal a Lesson in "Worst Practices", BGA, https://www.bettergov.org/news/chicagos-parking-meter-deal-a-lesson-in-worst-practices/
- Thomas. How Much 25 Major Cities Make in Parking Revenue Per Capita, Top View NYC, https://www.topviewnyc.com/packages/how-much-25-major-cities-make-in-parking-ticket-revenue-per-capita
- The Debt Spiral: How Chicago's Vehicle Ticketing Prices Unfairly Burden Low Income and Minority Communities (June 2018). Woodstock Institute, https://woodstockinst.org/wp-content/uploads/2018/06/The-Debt-Spiral-How-Chicagos-Vehicle-Ticketing-Practices-Unfairly-Burden-Low-Income-and-Minority-Communities-June-2018.pdf
- "Parking Violations and Fines - SF Transportation Code Penalty Schedule (2022). SFMTA," https://www.sfmta.com/sites/default/files/reports-and-documents/2020/10/fy_2021_fees_and_fines_effective_1.1.21.pdf
- "SFMTA (2018). Parking Citations, DataSF." https://data.sfgov.org/Transportation/SFMTA-Parking-Citations/ab4h-6ztd/data
- "Federal Financial Institutions Examination Council (2018). FFIEC Census Reports, FFIEC." https://www.ffiec.gov/census/report.aspx?year=2018&state=06&msa=&county=075&tract=&report=demographic&page=1
- "SFMTA (2010). Census 2010: Tracts for San Francisco, DataSF." https://data.sfgov.org/Geographic-Locations-and-Boundaries/Census-2010-Tracts-for-San-Francisco/rarb-5ahf
- "LCCR (2017). Paying More For Being Poor Report 2017." https://lccrsf.org/wp-content/uploads/LCCR-Report-Paying-More-for-Being-Poor-May-2017-5.4.17.pdf